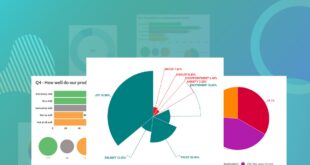
Charts help us make sense of complex information by simplifying them into bite-sized and colorful graphic visual representations. You can use visual representations of information to boost your brand and create captivating content for social media and websites. But how do you create charts that make an impact? This guide …
Read More » World Magazine 2024
